The 8 Most Important Metrics in Google Analytics
YOU MIGHT ALSO LIKE...


Lots of businesses spend a significant amount of their budget on digital marketing such as PPC, SEO, paid social media and digital advertising to push traffic to their website; but they’re not analysing what happens when users are on their site (or leave this to an agency to do for them), yet this is absolutely central to achieving their digital marketing goals.
Free Google Analytics Training
Your website is the ULTIMATE trackable piece of marketing you’ll own and it works for you 24-7-365! Immersing yourself in Google Analytics and getting to grips with how users are working their way around your website is going to be the key to your success! You can get free Google Analytics training here, and to get your started, here are the 8 most important metrics you need to be paying particular attention to in analytics, (first log into Google Analytics):
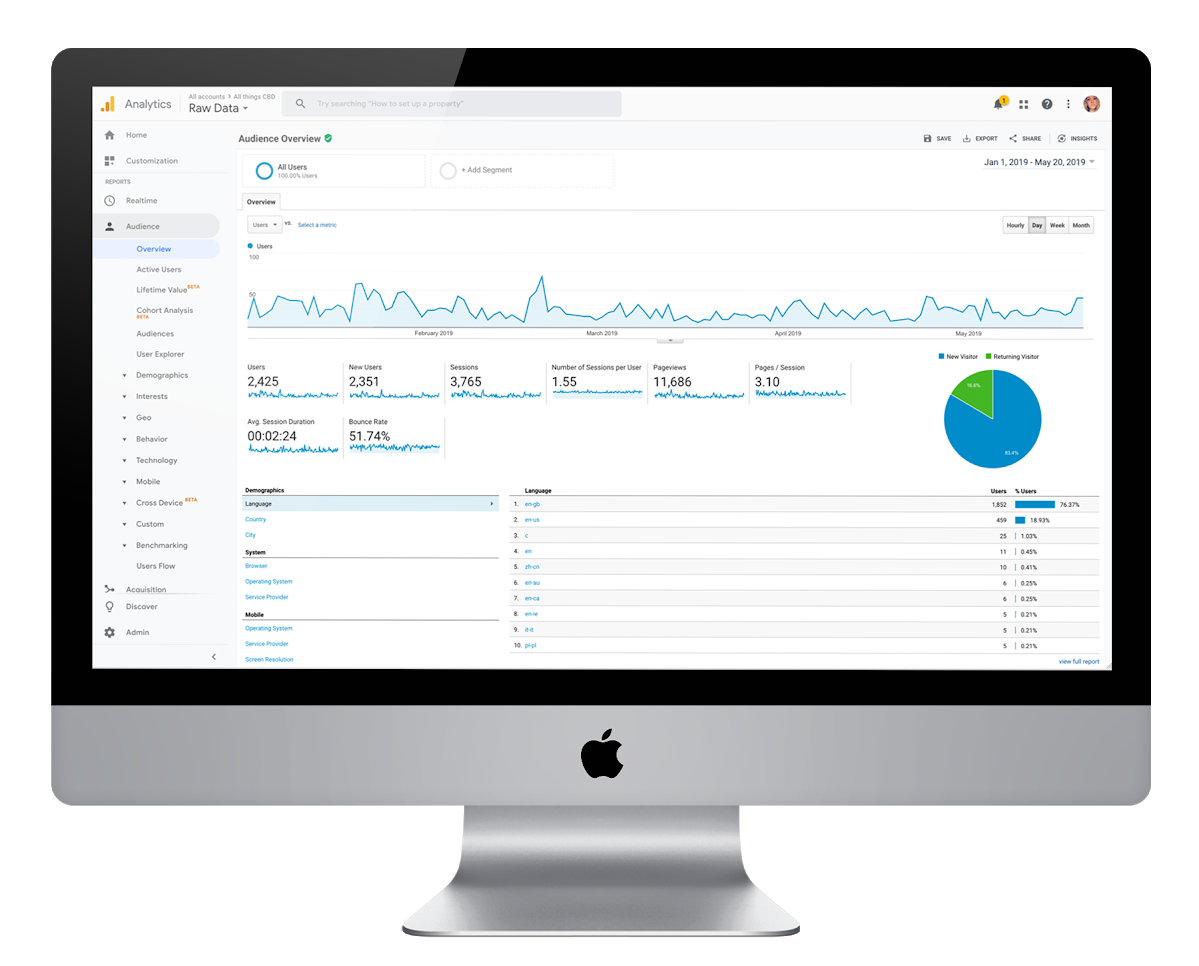
1: Audience Overview (found under Acquisition > Overview): This lets you know how much traffic is coming through to your website, what percentage is new and returning traffic, how many pages user have viewed and how long they’re staying on your site, as well as your bounce rate. This also gives you an indication of volume of traffic and how engaged that traffic is with your website. If your bounce rate is really high, it’s because users are coming on to your site and leaving without going any further than the page they’ve landed on. If your session duration is very low, users just aren’t engaging with your content.
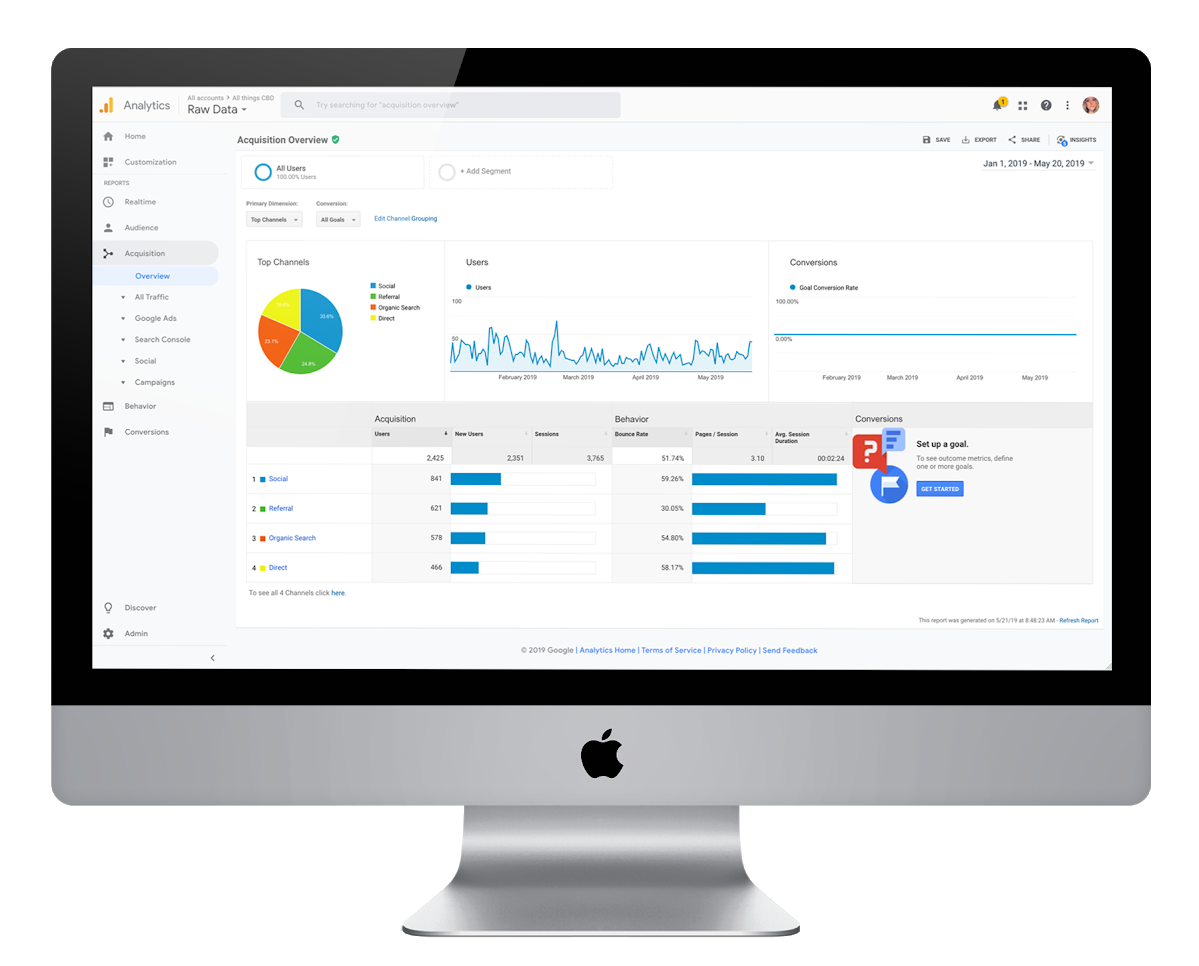
2: Acquisition Overview (found under Audience > Overview): This tells you where your website traffic is coming from. This is really important because, as seen in the example below, the most traffic for this particular website is coming from social media, which means plenty of marketing focus needs to go into developing your social media channels and it’s an indication the majority of visitors are using their mobile devices – so a mobile first website design is a priority. You can also view which devices visitors are using by going to Audience > Mobile > Overview.
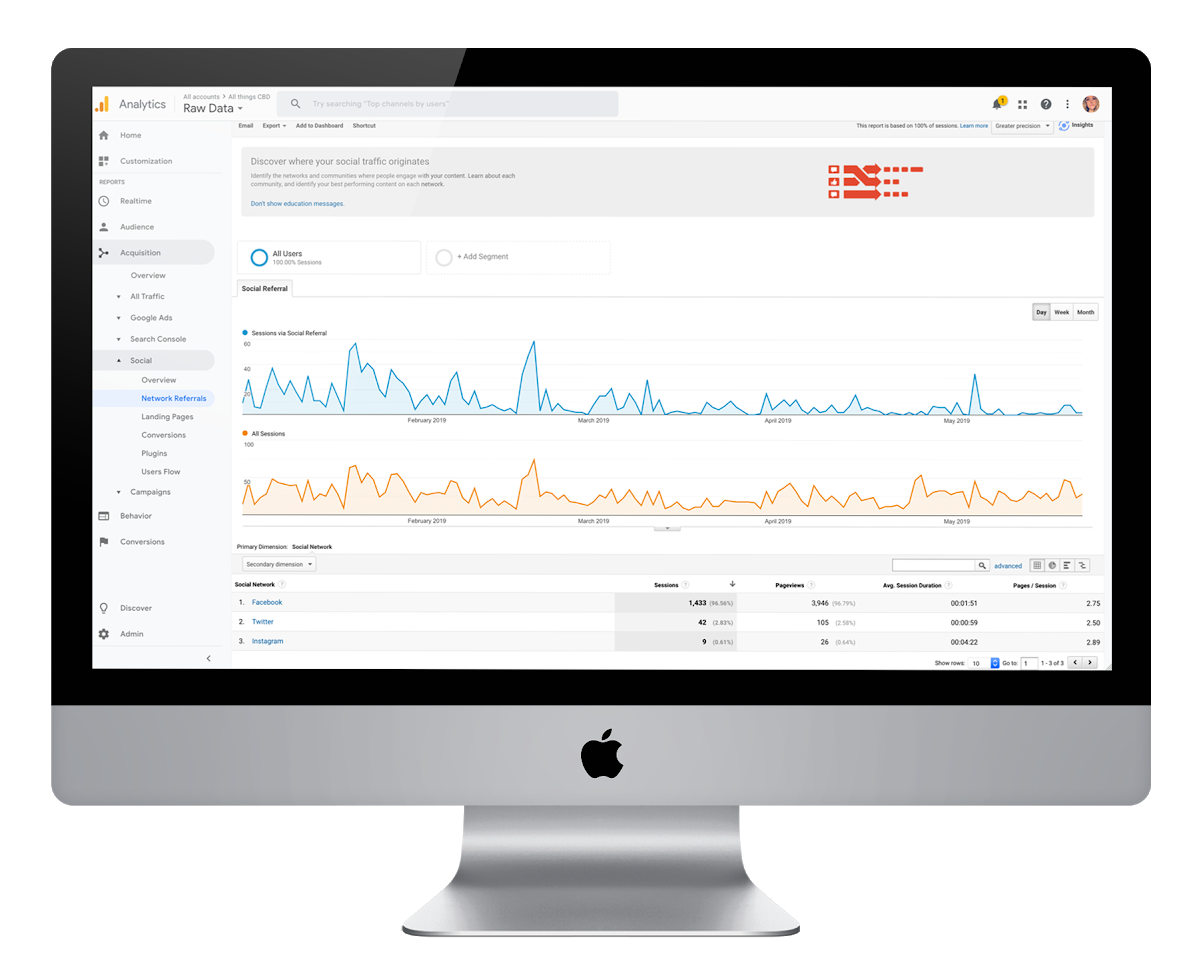
3. Social Overview (found under acquisition > social): This tells your where your social media traffic is coming from and how much! See which social channels are working the hardest for you and where your users ‘hang out’ on social.
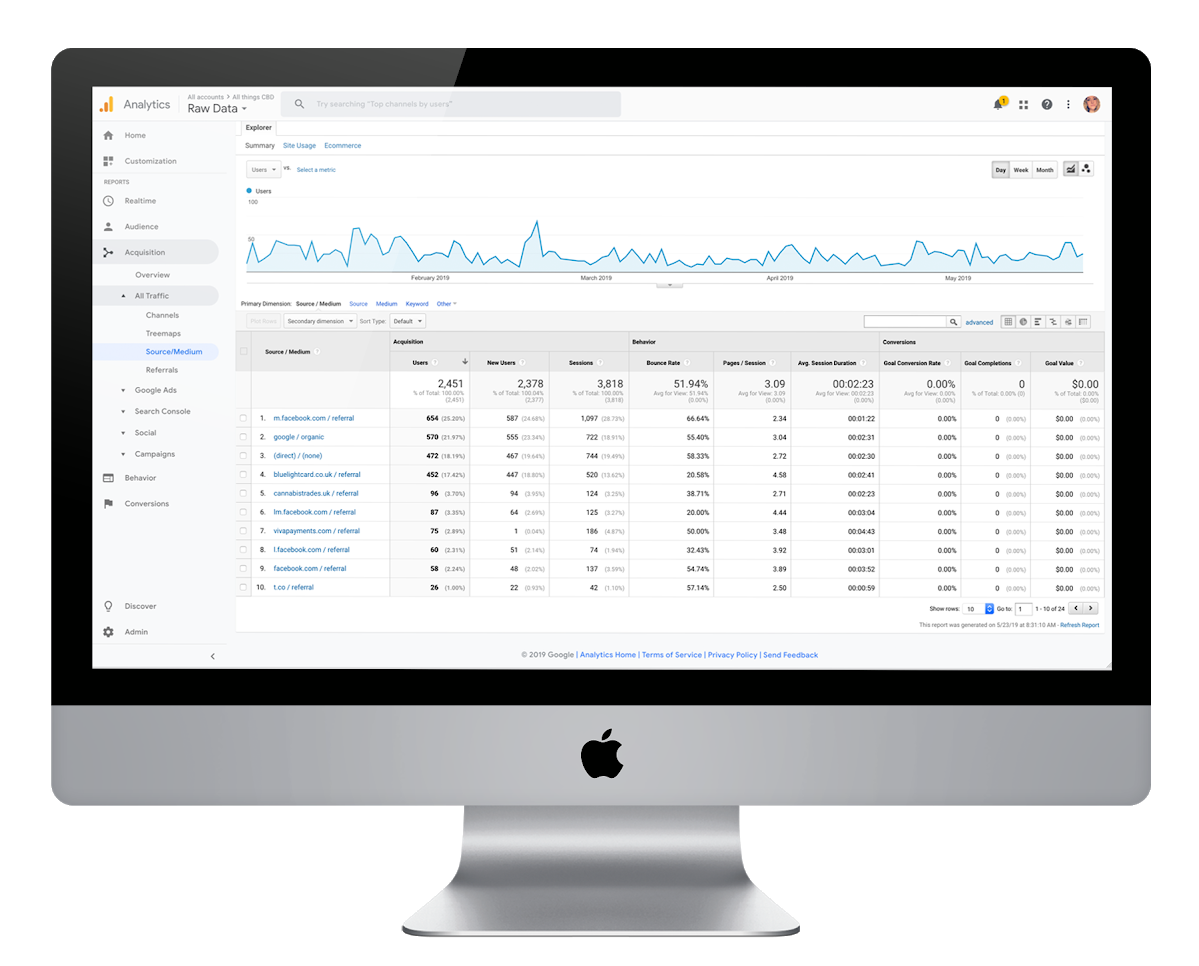
4. Traffic Sources (found under Acquisition > All Traffic > Source/Medium): This breaks down which websites your traffic is coming from, for example Facebook, Google, direct traffic, an offers website or another publisher’s website who might have blogged about your business.
5. Conversions: This can be a number of conversion types, from a straight forward purchase to a social media follow or email sign up; analytics lets you set up goals so you can monitor your important conversions.
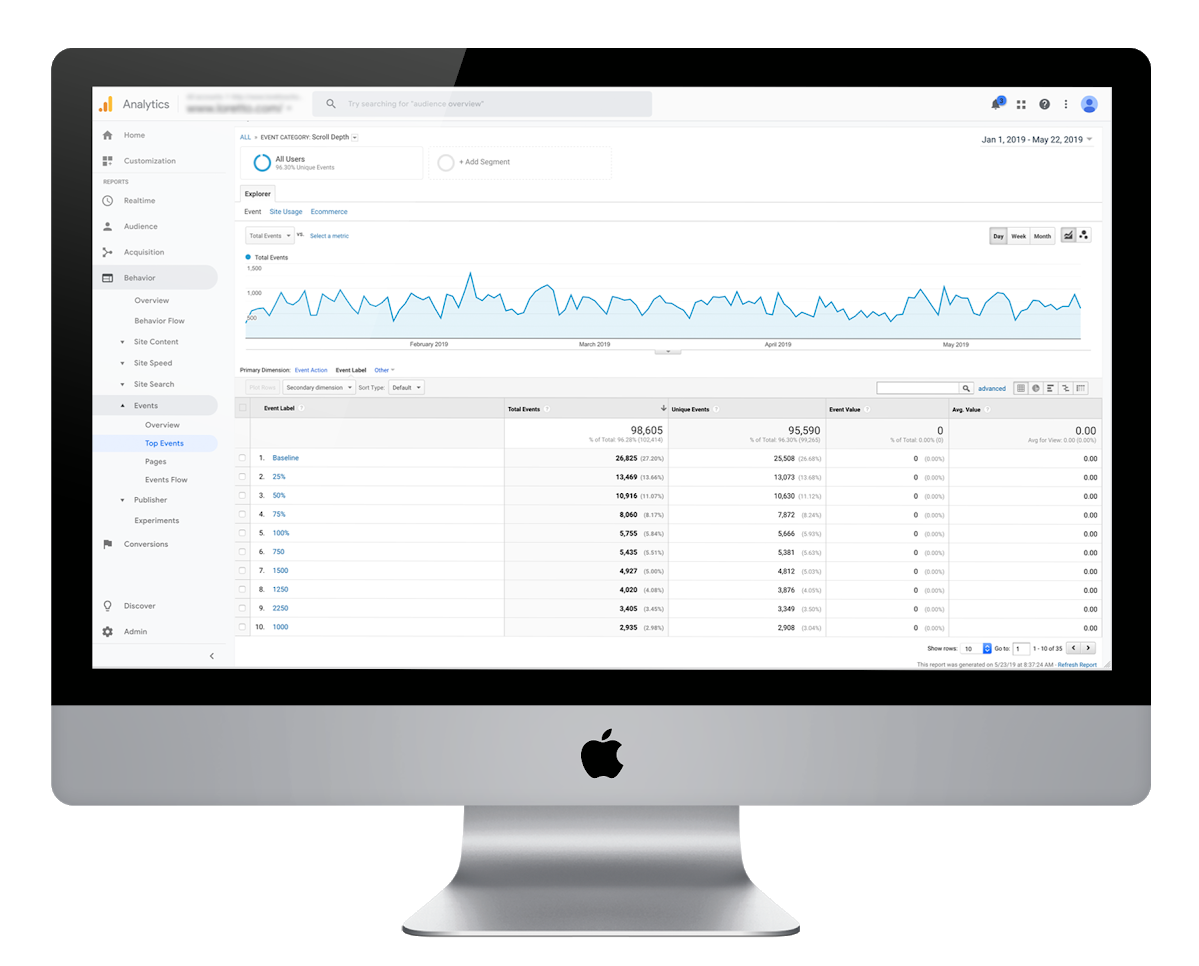
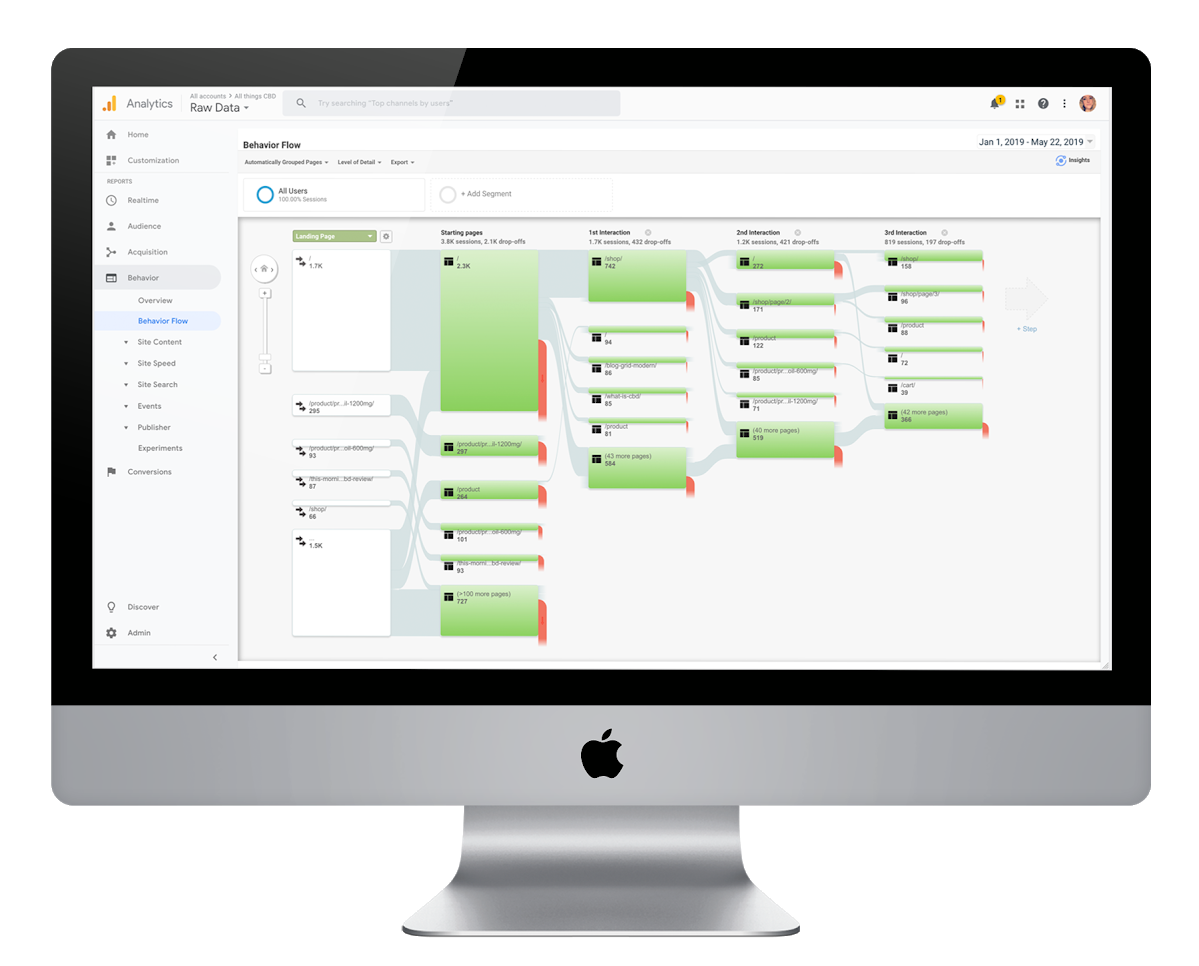
6. Interactions per visit: (found under Behavior > Behavior Flow): You can see which direction users went through your website, which pages they exited from and what your most popular entry pages are – savvy website owners will use this information to build better links between pages to push users through to a conversion.
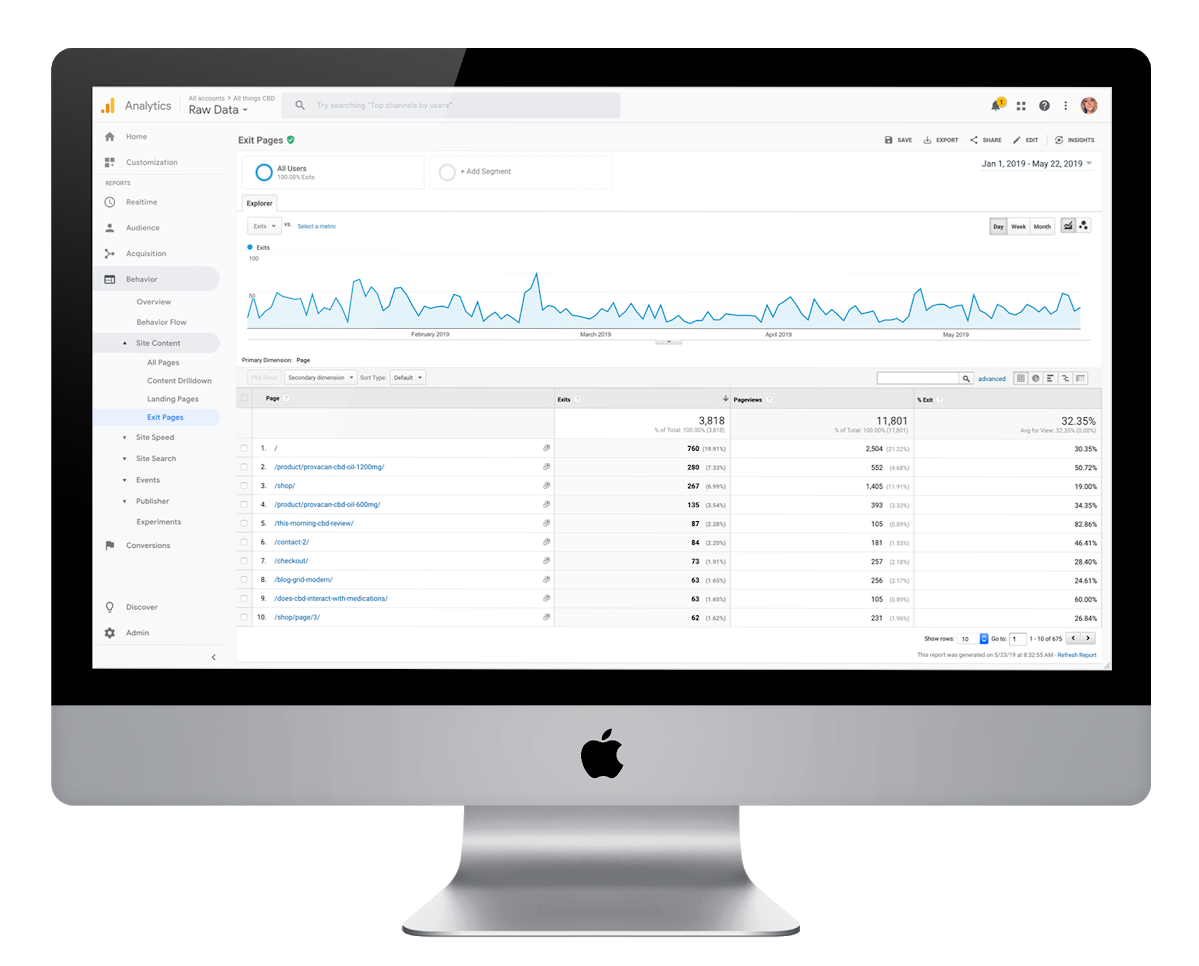
7. Exit pages: (found under Behavior > Site Content > Exit Pages): You can see which pages your visitors are exiting from. This might open up opportunities for ‘split-testing’ pages to see if you can improve your page drop offs.
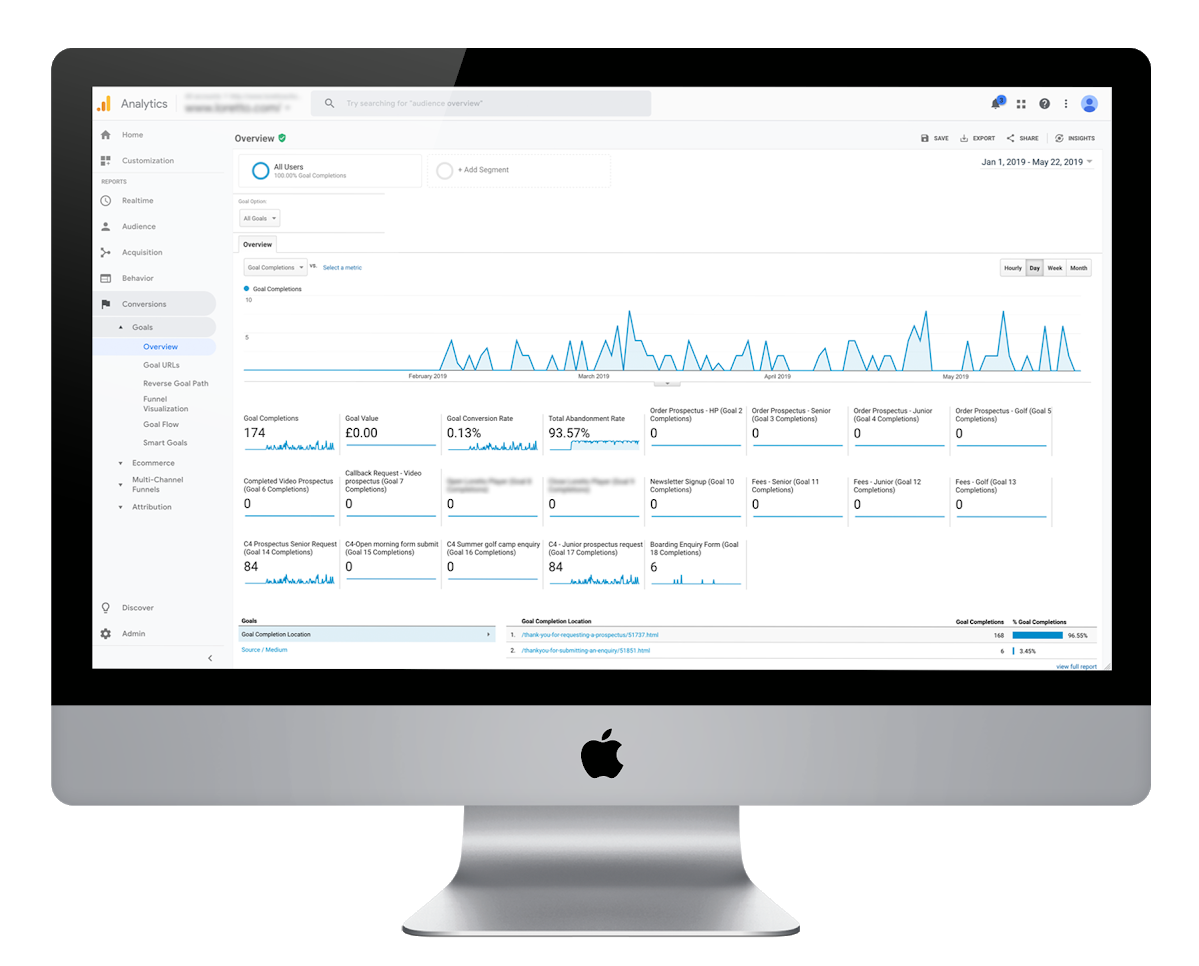
8. Goals: As we mentioned earlier, this can be anything from a Contact Form, a button click or a purchase! To set up your goals go to Conversions > Goals > Overview > Set up goals. You’ll find yourself under the Admin tab with two options:
+ NEW GOAL and Import from Gallery. + NEW GOAL enables you to set up your own goal, while
+ Import from Gallery displays a gallery of community made goals which you can use on your website. For example, here’s a popular goal for Contact Form submissions: The solutions gallery contains over 3,000 goals and is a fantastic starting point for goal setting.
Don’t get us wrong, analytics is quite a beast! But you don’t need to be familiar with all of it; these 8 metrics are a great starting point for you to understand more about your website users and how they’re interacting with your site. Having this information will give you things to think about and ideas for optimising conversion rates on your website.
Good Luck!